Climate change is having a dramatic impact on the world’s tropical forests: essential ecosystems for the health of our planet. The forests act as the lungs of the Earth, absorbing vast quantities of carbon dioxide and replenishing the atmosphere with life-giving oxygen. This vital ecological function helps to counteract the detrimental effects of climate change. These hyper-diverse ecosystems, which harbour up to half of all known species, have been the subject of extensive research by ecologists. Yet our understanding of the nuanced microclimatic (microclimate refers to unique climatic conditions within a small area) conditions experienced by the organisms residing within these forests remains limited – so it’s vital to understand exactly what those temperatures are and how they’re changing exactly where those organisms are living.
However, there’s historically been a problem when it comes to measuring them. Scientists have known about microclimate variability since as long ago as the 1950s, but until recently lacked the extensive instrument coverage to measure or computing power to estimate it comprehensively. That all changed with the advent of satellite remote sensing, which can be combined with ground measurements, big data processing and machine learning to make accurate temperature estimation. That’s fine if you want to know the temperature two metres above the ground in the open air, which is usually what these methods can measure, but of course that’s not where most of the life is – so if ecological studies are relying on that information, they’re likely to make inaccurate estimates of the temperatures actually experienced by the organisms living there. To get an accurate snapshot of those temperatures, something a little more accurate is called for.
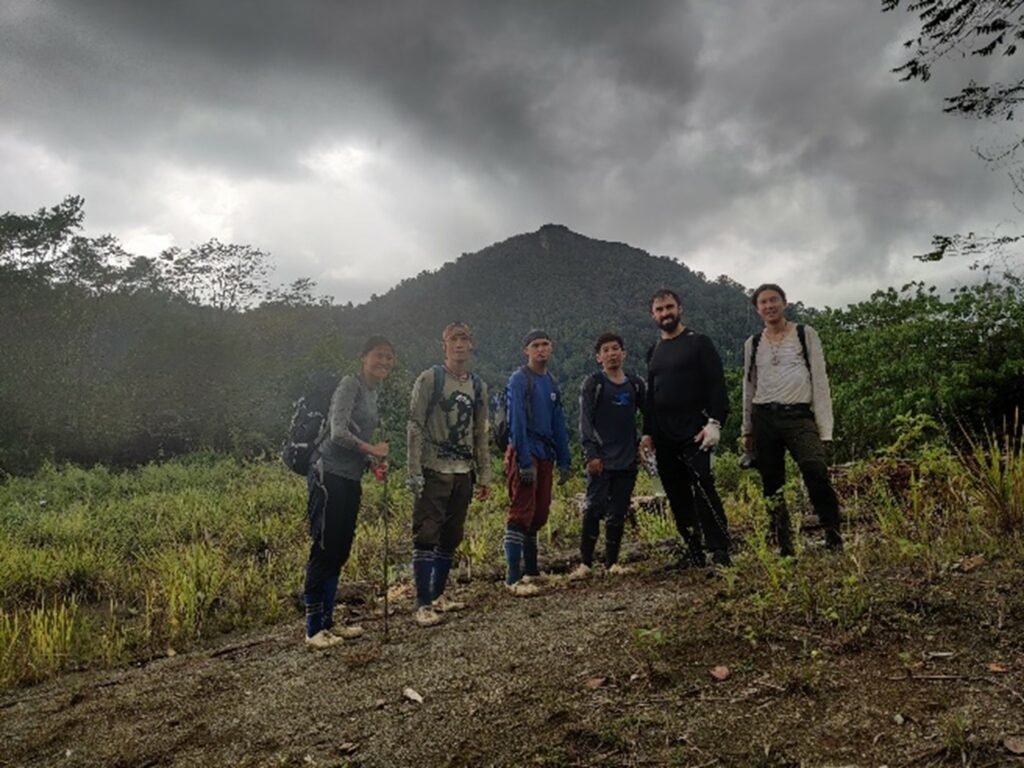
Enter Professor Amos Tai Pui-kuen and Dr Ali Ismaeel from The Chinese University of Hong Kong (CUHK)’s Earth and Environmental Sciences Programme, Professor Maeda Eduardo from The University of Helsinki and their team. In a groundbreaking piece of new research, funded by the Research Council of Finland, they used sensors that they installed in tropical forests around the world to record temperature data at a height of just 15 cm above the ground, allowing them to measure the temperatures within the understory – the layer of low-lying bushes and plants that sit close to the forest floor.

Working closely with local scientists, the team installed 180 of the sensors across Africa, South America and Southeast Asia, aiming to maximise the range of different geographical settings covered, as well as to encompass both degraded and preserved tropical forests. The locations include Mount Kenya National Park, Ngangao Forest and Mount Kasigau in Kenya, at altitudes from 1,730 to 2,450 metres; Mount Cameroon National Park in Cameroon; the state of Amazonas, Brazil; various locations in Mexico; Koro Headwaters National Park in Papua New Guinea; and Danum Valley Conservation Area in Malaysia. They measured the temperatures there for between eight and 26 months.
That’s only the first step. Even 180 locations were not enough to develop a high-resolution dataset of understory temperatures across the entire tropics. The researchers resolved to use a machine learning model to integrate the valuable microclimate data from the 180 locations with satellite-derived macroclimate data, open-air data as well as other biophysical and geographical data to produce an understory temperature dataset at a very high resolution of every 30 meters across the whole tropics. The results were eye-opening: on average, the understory temperature was 1.6 degree Celsius cooler than the open-air temperature, but that can rise as high as 4 degree in some places; the difference can mainly be attributed to the evapotranspiration of the forest canopy – the process by which water moves from the ground up into the atmosphere. Meanwhile, the diurnal temperature range – the difference between the highest and lowest temperatures on a given day – was found to be an average of 1.7 degrees Celsius lower near the forest floor than in the open air.
This is all critical information for policymakers, says Professor Tai. “Ecological models that use fine-scale microclimates can help us better predict how different species might react to climate change. These microclimates can sometimes shield species from the broader impacts of climate change, but they can also change in ways that affect species’ ability to adapt.
“These changes can influence the genetic diversity within a species, which is crucial for survival in changing environment. Microclimates also guide the seasonal movements of species, affecting where they can live and their population sizes. Understanding these interactions is key to predicting future shifts in species’ habitats due to climate change.”
The team further discovered that temperatures can vary dramatically within the same tropical forest, for reasons varying from the overlying weather patterns to vegetation characteristics to topography. In the central Amazon, for example, distinct habitat conditions have been found to occur at an average distance of 170 km. However, analysis based on open-air temperatures estimate this distance to be 400 km.
“We demonstrated that understory temperature exhibits greater spatial variability than the temperatures represented in datasets derived open-air weather stations and satellites,” says Dr Ismaeel. “This information is crucial for ecologists intending to study the spatiotemporal responses of species to climate change.”
The team is now engaged in follow-up studies that explore the impact of deforestation on microclimate warming. Another regional study is looking at the limits of microrefugia – small areas offering conditions in which creatures are still able to flourish when others are impacted by climate change – as the temperature continues to rise. Professor Tai says collecting longer-term understory temperature data should be a priority in the future, as should installing sensors in an even broader range of conditions.


